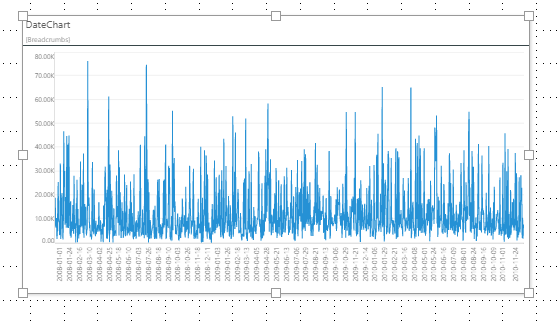
The range slider is available in both Discover and Present, and is used to zoom in and out of Cartesian charts that contain large amount of data. A Cartesian chart that contains many elements on the x-axis can be very difficult to navigate and read. Take, for instance, the line chart below, which shows sales by date. Such a chart can be quite challenging to interpret. While sometimes the solution may be to reduce the amount of data in the chart (for instance, by looking at months instead of dates), other times this isn't desirable.
- Click here to learn about the range slider in Discover.
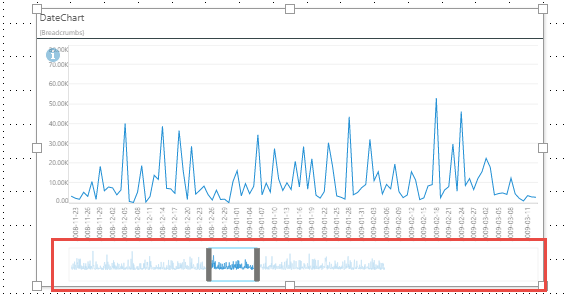
Enabling the range slider (red highlight below) provides a way for the user to easily navigate and interpret the chart. The range slider shows a range and a preview of the chart; the slider itself indicates which part of the chart to display, and the size of the range to display. Drag the slider right or left to display a different range of data. The sides of the slider (green arrows below) can be dragged to expand or reduce the zoom size.
Enable the Range Slider
If the chart was saved in Discover with the range slider enabled, the slider will automatically appear in the visual when it's added to a presentation. However, the slider can be disabled manually in Present.
If the range slicer wasn't added to the chart in Discover, it can still be added to the chart in Present.
The position of the slider will be determined by position set in Discover from the Range Slider drop-down menu.
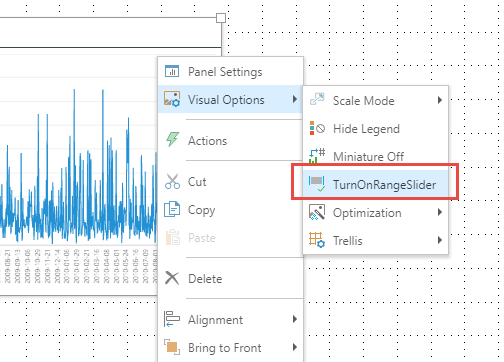
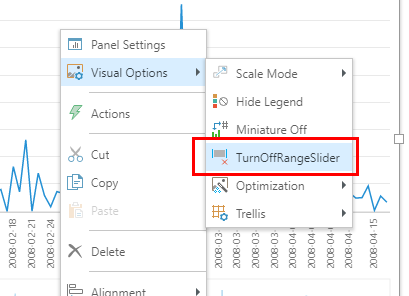
To enable the slider, right click on the visual to open the context menu, then go to Visual Options, and select Turn On Range Slider:
To disable the range slider, select Turn Off range Slider from the visual's context menu:
When enabled, the slider will appear in the visual in edit mode, but is only active once the presentation is launched in runtime.
Using the Range Slider
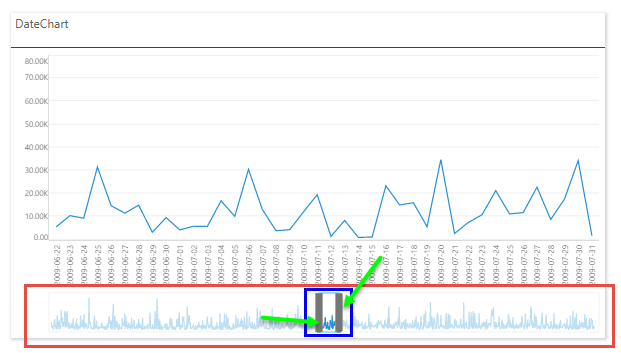
When the presentation is launched in runtime, the slider will become active and can be used to zoom in and out of the chart. The position of the slider (blue highlight below) in relation to the range (red highlight) determines which part of the range of data will be shown in the chart; drag the slider along the range to show the specified range in the chart.
The size of the slider determines the amount of data that will be shown in the chart; drag the sides of the slider (green arrows below) to increase or decrease the slider size (and therefore the range of data in the chart).
Hide the Range Slider in Runtime
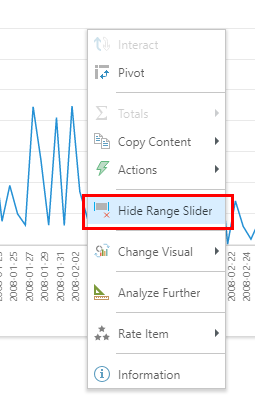
You can hide the range slider from the visual in runtime, without removing it. To do this, right click on the chart and click Hide Range Slider. Alternatively, hide the slider from the range slider settings (see below).
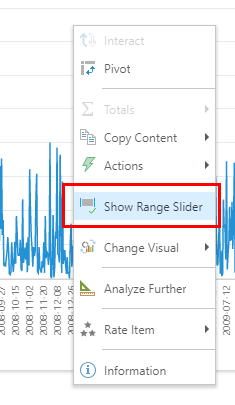
To show the hidden slider, right click on the chart and click Show Range Slider:
Range Slider Settings
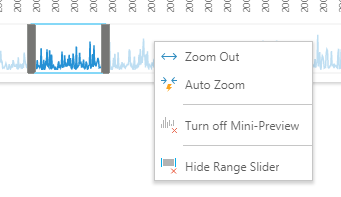
Right click anywhere on the slider to open its context menu.
Zoom Out: zoom all the way out to include the entire data range.
Auto Zoom: zoom in, letting Pyramid decide the optimal zoom size.
Turn off Mini-Preview: remove the mini preview of the chart from the range slider.
Hide Range Slider: hide the range slider in runtime. To turn the slider back on, right click on the chart and select Show Range Slider from the context menu.